
Written by Lori Collins, SVP, Giving Sciences, Truesense Marketing
One of the benefits of tracking donor perceptions and behaviors over time is seeing the subtle changes year over year that collectively add up to some surprising differences. The DonorGraphics annual study of charitable giving just hit its 12th year, which affords this window.
The Giving Shift: Charitable Giving Levels Out Between the Ages
Historically, there was a positive correlation to age and giving charitably. Generations were seen as “aging into” giving with substantial differences in giving rates by age, which can be seen in the 2012 data points below. While the overall proportion of charitable donors has been very consistent over the past dozen years — at 56% +/- 2 percentage points — there has been a democratization of giving in this time. This means that fewer older donors and more younger donors are participating, leveling the field.
While this leveling of the ages has been slow and steady across the past 12 years, it was also influenced by the political landscape over this time. Most notably, the presidential election in November 2016 that resulted in a party change motivated many younger generations to “vote with their wallet,” resulting in a wave of support for progressive-leaning organizations. (Gen Z and Millennials are more likely to give charitably to “right the wrongs in society” compared to older generations according to the same donor study.)
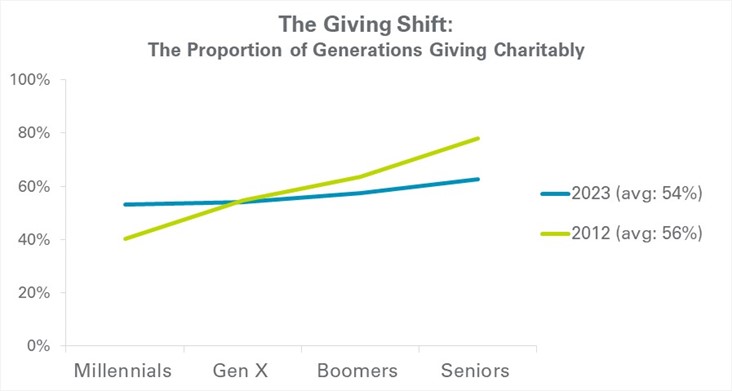
Source: TrueSense Marketing’s annual DonorGraphics study. Base: U.S. adults, N=2,229 in 2023; N=3,509 in 2012.
HHI More Predictive of Giving than Age
With the democratization of giving leveling out giving by generation, age has become less predictive of charitable giving over time. Household income (HHI) is most predictive of charitable giving, both in giving rate, as well as amount given annually.
In the views below showing the percent of the adult population giving charitably (green lines) and their average annual donations excluding major giving (blue bars), the increases are more subtle with advancing age on the left compared to increasing income on the right. This means that household income has a higher correlation to charitable giving compared to age.
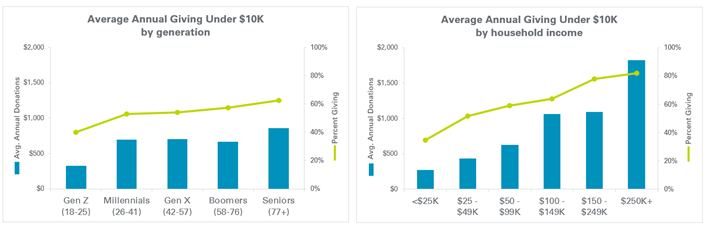
Source: TrueSense Marketing’s DonorGraphics study 2023. Base: U.S. adults, N=2,229, 54% of which are charitable donors (n=1,196). Self-reported monetary donations exclude donors giving $10K+ (2.3% of all donors).
Giving Time or Money
Combining the views of giving time or money by generation and household income shows a fuller picture of how people give their resources to the charitable causes that are meaningful to them.
Compared to charitable giving, which has a positive correlation to age and household income, volunteering has a younger skew, although that wasn’t always the case. Prior to the 2016 presidential election, the oldest and youngest generations had similar rates of volunteering their time, at 33%. Just like the charitable giving response following the election, younger generations leaned into volunteering, while older populations dropped. By early 2017, Seniors were volunteering at the rate of just 19%, while Millennials increased to an all-time high of 42%.
Volunteering rates normalized somewhat just prior to the pandemic, with the volunteering rate for both Boomers and Seniors rising to 24%. The volunteer rate of Boomers and Seniors dropped nine percentage points, to 15%, during the first year of the pandemic, and their rates haven’t yet recovered, with both generations currently sitting at 17%.
Interestingly, there is a positive correlation to volunteering with household income. Although it was not a focus of the DonorGraphics study, the highest volunteering rates among the top-earning households likely vary in the types of volunteer engagements.

Source: TrueSense Marketing’s annual DonorGraphics study 2023. Base: U.S. adults, N=2,229.
Giving Less Due to Inflation
Over the past 12 months ending May 2023, half (50%) of American (and Canadian) donors say they have given less to charitable causes due to inflation eating up more of their income. With the historic inflation highs over the past year (June 2022 hit a 40-year high of 9.1% YOY), most households felt the pinch. Higher income households were less likely to say they reduced their charitable giving, with about a third giving less (32%). This further cements the important role household income currently plays in charitable giving, not only due to higher income households giving more (in both rate and amount), but in the ability to weather turbulent economic times.
This means that the higher earning households over $250K — representing just 7% of U.S. households — are a highly coveted segment for support that many charitable organizations are chasing. According to the U.S. Census, another 13% earn between $150K and $250K, and their rate of charitable giving, even during the past year of giving reductions due to inflation, is similar to the highest earning segment. Therefore, these 20% of households earning $150K+, start to remind us of the Pareto principle, or the “80/20” rule.
While it’s not always the case that these 20% of higher earning households bring in 80% of donations, some organizations such as those in the medical and hospital vertical come close to this threshold when including all levels of giving.
Related to inflation and weathering a turbulent economy, it’s worth noting that in March 2023, Goldman Sachs forecast a 35% chance of a U.S. recession in the next 12 months. Consumers and charitable donors believed the risk was closer to 56% during that time. Importantly, this donor sentiment has been increasing over the past five years.
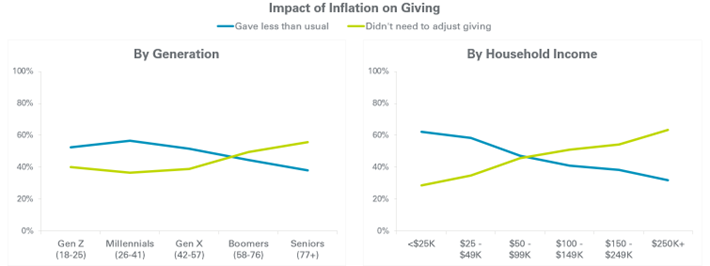
Source: TrueSense Marketing’s 2023 DonorGraphics study (fielded April – May 2023). Base: U.S. charitable donors, n=1,196.
Insights into Action
Some themes have emerged in profiling charitable giving by age/generation and household income. Two valuable giving segments are naturally smaller in size: Seniors represent about 5% of the U.S. population, and households earning $250K make up 7% of households according to the U.S. Census. With negligible overlap between these segments, and an average of just under three people per household (minus children under 18, present in about 40% of households), this means that charitable organizations are vying for support from these prime-giving segments representing roughly 10% of the U.S. population, or 13% of U.S. adults.
Thankfully, support comes from adjacent segments: those younger than Seniors, and in households who earn less than the top 7%. While their charitable giving dollars are less than the highest segments, and they are potentially less sheltered against a pending recession, they do bring in the bulk of individual fundraising dollars for most organizations.
While these insights come from 12 years of tracking charitable giving and are good bellwethers for trends, applying research and analytics to your own donor file will provide a solid foundation for data-driven strategy.
- Finding Your Own “Younger” Supporters
While Seniors are a valuable segment, they represent just 5% of the population. The rallying cry of all charitable organizations to “attract a younger donor” is clear, since many donor files are aging and losing valuable supporters, reflected in lagging multiyear donor response rates.
But what is “younger,” and how will you make your communication strategy relevant to this segment? Using appended data, a simple analysis of not only current supporter age, but also your organization’s five-year long-term value by generation results in your unique fingerprint of who the most valuable supporters are for your file. Each market and program is different, which means “younger” for one organization might be younger Boomers, while for others, the most valuable segment to grow might be Millennials.
Of course, supporters include volunteers, who naturally skew younger. Large brands like the American Red Cross rely on volunteers for 90% of their humanitarian work and monetize their value in real dollar terms.
- Using Household Income
Household income is readily available with age and very inexpensive to append. While HHI is a part of optimizing ask arrays (along with other wealth indicators plus charitable giving behaviors), it is perhaps best applied to predictive models — including mid/major identification, cultivation, as well as acquisition. From research on why people give — and why they don’t — we know that the number one reason adults don’t give is because they say they cannot afford it. This sentiment naturally reduces at higher income levels, so seeking out new sources of charitable givers means that overlaying income and other wealth indicators is critical to identifying new higher value donors.
- Find What’s Relevant to Your Target
Once you’ve determined your ideal targets, whether a certain age, income, or other characteristic, be sure you use donor feedback and/or research to identify the aspects of your program they are most passionate about supporting. Most charitable organizations have many programs and services, support of which varies predictably by age, income, religion, political affiliation, etc. This is particularly critical when talking relational fundraising — which has the benefit of direct communication to hear it from the donor directly, as opposed to inferring through the segmentation most common for mass market fundraising.
Want to learn more? Check out DonorGraphics.com for the latest insights in communication preferences and fundraising insights.